


Tax functions today are under increased pressure to make processes more efficient and ensure proper compliance and reporting, while still taking time to analyze and synthesize growing volumes of raw data to provide more strategic insights. Predictably, the increased focus on analytics and strategic reporting drives the need for organizations to transform their tax functions, and state and local tax (SALT) functions have become a key focus.
Some of the greatest challenges the SALT functions of today face relate to inefficiencies in large spreadsheet-based calculations that are carried over from year to year, manual tax software inputs/overrides, and the use of large, cumbersome work papers. Just maintaining the status quo in the face of increased data management and reporting demands has driven up the staff hours needed to meet state and local statutory deadlines, leaving less time for the strategic planning initiatives companies now demand.
These process considerations and the nuances of state and local taxes, including the impacts of federal tax reform and the U.S. Supreme Court’s historic ruling in South Dakota v. Wayfair et al.,1 present unique challenges to state and local tax professionals. However, these unique challenges present opportunities for SALT functions to leverage automated data workflow processing, data visualization, robotic automation, and other automation tools not only to react faster but also to deliver critical insights, reduce risk, and deliver other value-added benefits to their organizations. In fact, because the SALT function involves ingesting vast amounts of nonstandard data from disparate sources, it is well suited to benefit from these emerging technology and automation tools. In this article we discuss our own digital journey at PwC, provide an overview of several technology and automation tools used by SALT functions today, and, finally, delve into several companies’ real-life SALT function digital journeys providing examples of where companies have realized the most benefits from technology and automation tools.
PwC’s Digital Journey
PwC has embraced the opportunity to integrate new data ingestion, analysis, and visualization tools to transform the tax function. PwC leverages technology to help companies drive greater internal efficiency and realize improvements in day-to-day activities and is invested in preparing its workforce to think digitally, developing new skills to thrive in today’s fast-paced and complex business environment. To do this, PwC is focusing on the digital experience, for both its people and clients, driven by a unified digital vision, our “Digital Fitness for All” mantra, and our willingness to self-disrupt to drive innovation. This digital journey started over five years ago. Significant milestones include:
- 2013: Committed to self-disruption by adopting collaboration tools and office technologies;
- 2014–2015: Developed a culture of real-time feedback with digital coaching and performance management tools that emphasize in-the-moment, effective, and ongoing improvement;
- 2017: Launched “Your Tomorrow,” a firm-wide reimagining of what it means to work at PwC in the digital age. PwC also developed and launched a digital fitness assessment app to employees and the leadership team to support our digital upskilling journey; and
- 2018: Launched the Digital Accelerator initiative to develop a dedicated team of digital champions to drive innovation at the ground level. In addition to launching the Digital Accelerator initiative, PwC is working to digitally upskill its entire U.S. workforce by June 30, 2019, and acknowledges an individual’s digital knowledge and skills with Digital Acumen knowledge badges, earned upon completion of four interactive, industry-based scenarios that focus on technologies that include artificial intelligence (AI), augmented/virtual reality, blockchain, robotics, 3-D printing, and drones.
By living through many of the same technology transformations and digital upskilling initiatives that companies are considering or starting now, PwC is positioned to leverage its experience to assist companies as they develop their vision of the tax function of the future and to support them along their own digital journeys.
Technology and Automation Tools Used by SALT Functions
Throughout PwC’s digital journey, a number of different technologies and automation tools have emerged at the center of the transformation efforts. This section provides an overview of some of the more prevalent technology and automation tools used by organizations embarking on digital transformation initiatives. Each technology and automation tool can be deployed separately or in combination (which creates a technology multiplier effect) to fully automate large processes, such as state return apportionment, from beginning to end with the push of a button.
Automated Data Workflow Processing
Automated data workflow processing tools (automated data processing) can be categorized broadly as tools that “extract, transform, and load” (ETL). Most incorporate this functionality into a workflow format so that once configured, the workflow process can be repeated to produce consistent outputs. This workflow configuration allows for changes made to documents feeding the workflow to be processed through the workflow in seconds, potentially eliminating hours of effort needed for updates incorporating even minor changes. This increased data processing speed also comes with reduced risk, because there are no additional manual steps involved.
Another key feature of automated data processing tools is increased visibility when reviewing complex calculations and data manipulation processes. Each larger process in the workflow is broken out into a separate visual automation step and the input(s) and output(s) can easily be reviewed prior to use. This easier-to-understand format and the increased transparency of the calculations further differentiate automatic data processing tools from other spreadsheet software tools, which calculate and manipulate data using hidden and complex formulas that are difficult if not impossible to review and to understand unless you wrote them.
Workflows can also be leveraged to extract and manipulate data without relying on IT, database administrators, or divisional locations to natively configure or pull reports, vastly improving the speed with which tax can obtain access to data. Finally, the output from automated data processes can be used with other technologies, such as data visualization tools or other database systems, creating a multiplier effect by using multiple technology and automation tools to create a seamless, holistic solution.
Data Visualization
Data visualization tools can connect easily to nearly any data source (including automated data workflow outputs outlined above) and transform raw data into interactive and dynamic visualizations that allow for enhanced analysis and insights. Data visualization can be used as a highly effective communication tool, turning complex data sets into easily accessible, simple-to-understand pictorial representations of the data that can shed light on previously unseen trends and relationships. Most individuals are visual learners, and the enhanced visualization capabilities within data visualization software offer numerous additional ways to display information, such as a heat map of the United States or a state-by-state tax liability table with entity and year filters.
Interactive and customized filters of any type can be added to these visualizations to make a more dynamic experience for end users, allowing them to better interact with and further explore the data for insights, trends, and variances, among other benefits. Finally, standardized visualization templates can be built so that consistently formatted outputs from a tax software system, automated data workflow, or other source can be linked into templates that already have the visualization format and filters built. The standard visualizations can then be used or further customized to link into source data that can visualize changes to versions almost instantaneously.
Robotic Desktop and Process Automation
Robotic desktop automation (RDA) tools allow users to build what are commonly referred to as bots, using drag-and-drop functionality similar to visual programming. These desktop user-built bots can mimic the interaction of users with computers, work cross-functionally and across applications, and enable automation of repetitive, rule-based, and data intensive processes.
At the highest level, bots automate any process that includes a keystroke on a computer or a click of a mouse. These processes must have clear, defined logic and rules. Each scenario or outcome must be built into the bot, and a wide range of possible outcomes or variables can make programming the bot to respond to each very time consuming. A stable environment is also required, because if a particular button or desktop format changes, most bots will not be able to interpret this on their own, and the automation will fail. These limitations, however, have less impact as new software and features become available that can apply more flexible logic to the bot’s programmed activities, leading to additional processes that can be automated using RDA tools. RDA tools paired with any of the other technology and automation tools, while more complex to build, can result in greatly enhanced automation benefits.
Another type of robotic automation that SALT functions further along in their digital journey are using is robotic process automation (RPA) tools. RPA tools are used primarily for larger, more complex enterprise-wide automations. Unlike RDA tools, which run on individual user desktops, RPA tools run on an organization’s servers with little to no intervention. Once built and deployed these RPA tools can be programmed to run at set times.
Today many SALT functions complete this task for states without e-filing by printing out all the state returns along with different copies of the federal returns.
Technology and Automation Tools in Specific SALT Scenarios
One of the unique challenges faced by the SALT function is that each tax type (e.g., sales and use tax, property tax, income and franchise) has differentiating features, including the type and frequency of data required to consider when managing the processes. Each type of state and local tax is unique, but what all have in common is the volume of data and standard files, forms, and templates processed in each area, making many SALT processes particularly well suited for technology and automation tools. Highlighted below are examples of three areas within the SALT function that technology and automation tools can be used to realize benefits.
Sales and Use Tax
For many companies, the Supreme Court’s June 2018 decision in South Dakota v. Wayfair created a dramatic increase in reporting responsibilities and created an overnight need for indirect tax functions to evaluate opportunities for innovation and seek tools that create capacity without increasing resource requirements. The typical monthly nature of many jurisdictions’ filing requirements lends itself to repetitive process.
Even prior to the Wayfair decision, many companies experienced prolonged data collection and manipulation efforts, often taking the better part of two weeks of effort, with a number of individuals working to prepare and file returns. This repetition applies to provisioning and processing data through return preparation, and includes administrative tasks to finalize the process. One cycle is barely completed before the next begins. Additionally, the transactional nature of the tax means that a large volume of data must be considered to calculate the tax correctly. Excise taxes, including cigarette and tobacco, motor fuel, and others, present similar hurdles. To address these challenges, PwC assists organizations in solving these issues with technology and automation tools that aggregate data from multiple sources, facilitate data normalization, and reduce time spent on administrative tasks.
In one recent example, a company with many concurrent acquisitions had to gather data from multiple, disparate enterprise resource planning (ERP) systems to obtain the necessary information to complete its sales tax filings in multiple jurisdictions. Not only did the data need to be filtered, sorted, formatted, and otherwise manipulated to allow it to be combined into a single source, but newly acquired entities were continually incorporated into this already complex process.
To help resolve many of these challenges, PwC worked with the company to develop a standard data template to simplify the information consolidation process. Then, using the automated data processing tools described above, each data source was transformed and formatted to fit this standard template. Once it was confirmed that the automated process produced the expected results, each subsequent month automatically generated an output file in this standard format. What once was a multiday process was now reduced to a few minutes of processing time, data extraction from multiple source systems, and combining the data automatically to produce a uniform, tax-sensitized report. The significant reduction in time spent manipulating and preparing data is now time the company’s in-house indirect state and local tax team spends reviewing, analyzing, and visualizing trends in the data.
Another key automation opportunity within the indirect state and local tax space relates to the self-assessment of use tax. Given that to analyze purchase information for properly paid tax typically starts with obtaining data from multiple source systems and compiling and analyzing large data files, use tax analysis is particularly well-suited to leverage and link up multiple technology and automation tools to allow companies to lower review thresholds to drive greater accuracy.
With technology and automation tools, no solution is one-size-fits-all. Many companies PwC has worked with over the years have reported that combining different technologies has created synergies and results previously realized only through using a standalone tax engine module or relying on complex manual spreadsheet calculations and days of manual review. Companies that had once determined that a tax engine was unsuited, for myriad reasons, to their businesses are now finding that technology and automation tools put tax in the driver’s seat. Tax departments can now often meet their own technology needs less expensively and address their organizations’ use tax obligations more effectively than with previous options.
A growing number of tax functions are combining these technology and automation tools to create a customized use tax calculation engine that can apply complex use tax rules on data, including logic around usage exemptions for manufacturing, allocation of software licenses across multiple jurisdictions, and many other scenarios as part of the routine review of transactions. Historically, even with a relevant software package, companies still required manual workarounds to resolve determinations that could not be automatically classified due to system functionality limitations. By instead building and leveraging customized automated data workflows and RDA tools to process the data, apply the unique logic needed, and generate tailored reporting, companies are finding that the process has become more efficient and is a more cost-effective option that can scale and change with the business.
Property Taxes
Preparing, reviewing, and filing property tax returns is a fairly standardized, data-intensive, low-value, low-risk, and time-consuming compliance process for most organizations. These traits make property tax an ideal area to automate. Building property tax automations using automated data workflow processing, RDA, and data visualization tools can enable reviewers to analyze thousands of assets for year-over-year variances or valid current-year data in minutes versus the hundreds of hours it currently takes without them. In addition to the year-over-year variance analysis and current-year validation check, PwC has helped in-house SALT professionals and leaders build automated data workflow processing tools and data visualization software to calculate and visualize what each property tax return should look like before being imported into the return software.
With the ability to filter easily by entity, filing location, or year, data visualization allows the reviewer to evaluate large quantities of returns all within one visualization dashboard. This visualization can also include additional dashboards with higher-level analytics and heat maps that can be used when providing executive level updates. Through the use of these technology and automation tools the SALT function today can reduce time spent on non-value-added property tax compliance, increase the organization’s insights into its property tax footprint for credit and incentive opportunities, and reduce risk.
State Income and Franchise Tax
The state and local income and franchise tax return compliance process has many different and complex sub-processes and components that can lead to risk and inefficiencies. One sub-process prone to inefficiencies is calculating state apportionment. State apportionment is challenging for many SALT functions, because in most cases the data is housed in disparate systems with limited user access.
Further, voluminous multistate apportionment laws and regulations result in inherent complexities. Add to that the additional resources needed to grapple with the impacts of recent federal tax reform, and you can see why SALT functions are focusing on state apportionment as a starting point for digitization. PwC has worked with organizations to leverage automation data workflows and visualization tools to aggregate hundreds of apportionment division packages, manipulate and format, apply tax logic, and output a tax software–ready to import file and an output file formatted to link directly into a visualization template already built. Once built, the automation data workflow can be run and, in a matter of minutes, sales, property, and payroll apportionment is calculated and visualized in dynamic work papers and reports. The visualization can also be built to include year-over-year apportionment variance analytics with the ability to change the sensitivity for marking a variance as needing additional review without rerunning the workflow.
Another key area within the SALT function where technology and automation tools are useful when starting a journey of digital transformation is around the often voluminous non-value-added administrative tasks involved with state and local income tax return compliance processes. An example of this includes attaching the correct copy of the federal return to each state income tax return. Today many SALT functions complete this task for states without e-filing by printing out all the state returns along with different copies of the federal returns. Staff members, and sometimes managers, then spend countless hours confirming the correct federal return attachments for each state return and then hand-attaching the forms. Working with a SALT function that identified this as a major pain point, PwC leveraged automated data workflow processing tools and RDA to electronically attach the correct federal return attachments based on state-by-state attachment logic to all returns. This was a quick win for the company in an area where PwC has seen many SALT functions spend hundreds of hours annually without even realizing it.
These are just two examples of using technology and automation tools in the state income and franchise tax area. Other automation opportunities include calculating state current and deferred rates, tracking and responding to notices, calculating state extensions and estimates, and even preparing state returns using RDA tools.
Beginning the Journey to Digital Transformation
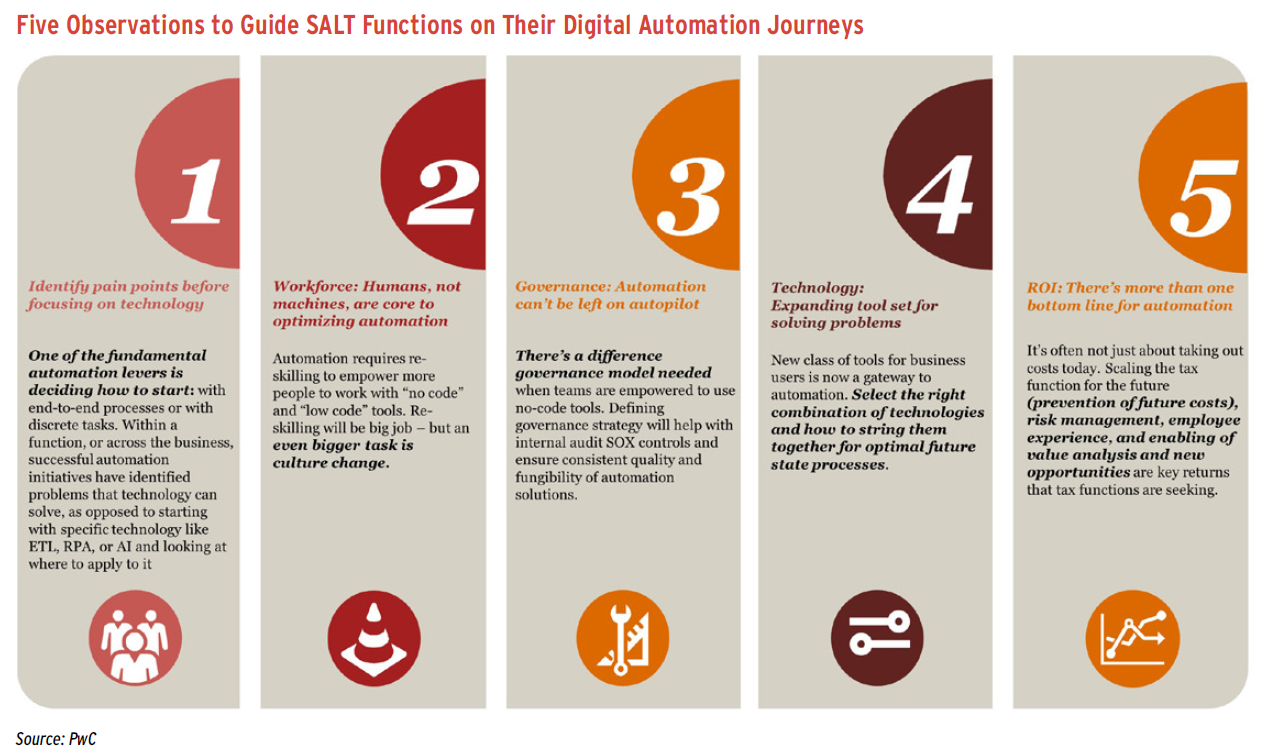
With all the complexities and challenges in-house SALT functions face today, it is critical to understand and leverage the proper technology and automation tools. Working with organizations to help them understand how these tools can solve problems, we continually note the following observations that, in addition to the overview and guidance provided above, may help guide SALT functions as they start their own digital automation journeys:
- Identify pain points before focusing on technology.
One fundamental automation lever is deciding how to start. For example, does your company attempt to tackle problems with end-to-end processes or discrete tasks? Regardless of approach, within a function or across the business, successful automation initiatives tend to identify problems that technology can solve rather than start with a specific technology and looking where to apply it;
- Workforce: humans, not machines, are key to optimizing automation.
The most effective projects we have encountered are those where the tools are applied at the key points in a process to make the most difference, without disrupting what otherwise works. Although nearly every step of the process can be automated, finding the precise places where automation and tax personnel can interface to make the most impact is often what distinguishes successful projects;
- Governance: automation cannot be left on autopilot.
Automation requires re-skilling to empower more people to work with “no code” and “low code” tools. While re-skilling is a big job, an even bigger task is culture change. There is also a different governance model needed when teams are empowered to use no-code tools. Defining a governance strategy will help with internal audit and Sarbanes-Oxley controls and will enable consistent quality and make automation solutions fungible;
- Technology: expanding the tool set for solving problems.
New classes of tools for business users are now a gateway to automation. Selecting the right combination of technologies and determining the ideal way to tie them together will promote optimal future state processes by creating an ecosystem where automation becomes an integral part of the process; and
- Return on investment (ROI): there’s more than one bottom line for automation.
It’s often not just about taking out costs today. Scaling the tax function for the future (preventing future costs, managing risk, enhancing the employee experience, and enabling value analysis and new opportunities) are key returns that tax functions are seeking and realizing through investment in technology.
As the tax function’s responsibilities adapt and grow in response to landmark events such as tax reform and Wayfair, the proliferation of technology and automation tools helps to address the question of how to do more with less, all while driving strategic decision-making and reducing the time spent on low-value-added activities. This is an exciting time to be a professional in the SALT function, and there has never been a better time to embark on your own digital automation journey.
Mike Kammann is a state and local tax director at PwC in Detroit, where he focuses on state automation and reporting. Amee Appel is a state and local tax director at PwC in Chicago, where she focuses on indirect state tax automation and reporting. Jason King is a state and local tax manager and Digital Accelerator at PwC in Chicago.
Disclaimer: This content is for general information purposes only and should not be used as a substitute for consultation with professional advisors. PwC refers to the U.S. member firm or one of its subsidiaries or affiliates, and may sometimes refer to the PwC network. Each member firm is a separate legal entity. Please see www.pwc.com/structure for further details.
Endnote
- South Dakota v. Wayfair, Inc., et al., No. 17-494 (June 21, 2018) 585 US.