


Business transactions such as mergers, acquisitions, and business reorganizations often require valuations of intangible assets. Applying different standards may result in different valuations for the same intangible asset. It is therefore important to identify the appropriate valuation standard before attempting any valuation of an intangible asset.
Significant differences may arise between fair value established for financial reporting and values derived from either of the two standards—fair market value or arm’s-length value—used for tax reporting. In certain instances, a valuation may need to satisfy more than one of these three valuation standards. For intangible assets, a fair valuation for financial reporting and a fair market valuation for tax reporting may be required for purchase price allocations in an acquisition, followed by an arm’s-length valuation for transfer pricing purposes in a post-acquisition business restructuring.
The framework for deriving the value of intangible assets may vary greatly among standards. The three standards mentioned above have many nuances specific to each even as they share similar principles and methodologies, such as the application of the income, market, and cost or asset approaches under the fair market value (FMV) standard and the fair value standard or the similarity of the relief-from-royalty and comparable uncontrolled transaction-based income methods under the FMV standard and the arm’s-length standard (ALS).
The subject of this article is intangible valuation for tax purposes, so we will focus on the differences between the FMV and the ALS in the context of intangible valuations. Other differences from the fair value standard performed for financial reporting purposes and certain other asset-specific considerations for tangible assets, financial instruments, and business enterprise valuations are outside the scope of this article.
Fair Market Value Standard
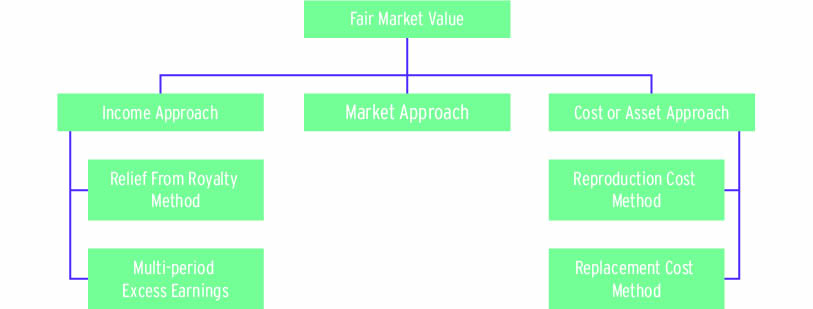
The FMV standard is a tax valuation standard primarily applied in certain federal corporate income tax, state income tax, estate tax, and gift tax matters. FMV, as described by Internal Revenue Service Revenue Ruling 59-60, is the price at which property would change hands between a willing buyer and a willing seller when the buyer is under no compulsion to buy, the seller is under no compulsion to sell, and both parties have reasonable knowledge of relevant facts.1 As Figure 1 shows, the three approaches most commonly applied in FMV analyses are the income approach, the market approach, and the cost or asset approach.2
The income approach determines the value of an intangible asset based on future returns discounted to present value through an appropriate discount rate. This approach may be difficult to apply when the subject entity lacks positive cash flows. The market approach establishes the value of an intangible asset based on market values of similar intangible assets sold under similar conditions. This approach may be difficult to apply when transaction data is inadequate or inconclusive. The cost or asset approach estimates the intangible asset value based on the cost required to either reproduce or replace the asset. This approach may be difficult to apply, since economic obsolescence or future income potential may be difficult to quantify.3
In the following sections, we outline some methods commonly used in each approach.
Income Approach
The income approach is appropriate when the subject entity derives significant value from operations and generates positive cash flows from a reliable forecast of future performance, and the underlying risks associated with the forecast may be reasonably quantified through an appropriate discount rate.
The income approach uses two primary methods—relief from royalty and multi-period excess earnings—among others. Under both, quantifying the appropriate revenue streams, estimating an appropriate useful life, and developing an appropriate discount rate are important to establishing a reliable value for the intangible asset.
Revenue Streams
Under both the relief-from-royalty and the multi-period-excess-earnings methods, an appropriate revenue stream associated with the intangible asset must be established as grounds for the analysis. The revenue stream should be based on reliable financial projections grounded in observable data as of the valuation date.
The reliability of the financial projections may be assessed by analyzing historical results and prior forecasts, reconciling the data with analyst expectations, performing industry and market share analyses, or evaluating individual value drivers. For publicly traded companies, reconciling market capitalization with the financial projections may also be helpful in assessing the reasonability of the projections.
However, the current environment may undermine these traditional tools and techniques, and many industries and businesses may not be able to rely on prior years as indicators for 2023. In addition to post-pandemic considerations, there is uncertainty around the resulting energy crisis exacerbated by supply chain disruptions, inflationary pressures, the war in Ukraine, and a potential global recession.
As a result, a single-factor model may be insufficient to establish reliable financial projections. Combining the traditional methods with scenario analysis that identifies and characterizes key factors and develops scenarios around them, and applying probability-weighted financial projections, could help account for the impact of these uncertainties.
Useful Life and Attrition Rate
Another important consideration when applying the income approach is determining an appropriate useful life and attrition rate for intangibles. Revenues for intangibles should be projected over their estimated useful life based on expected revenue growth and should account for attrition, if appropriate. The estimate requires market data analysis, management discussions about the nature and characteristics of the intangible, and a certain level of professional judgment.
Generally, an intangible asset’s useful life ends when it may no longer be expected to generate significant revenue. However, certain intangibles may exist into perpetuity, wherein a terminal period may be required. And in some instances, an attrition rate may be needed to account for economic obsolescence depending on the intangible asset being valued.
Discount Rate
In a valuation analysis, the discount rate reflects an investor’s required return for the time value of money and the investment’s relative risks. The discount rate is applied to discount future revenue streams in order to establish a present value estimate for the intangible asset. To establish an appropriate discount rate, valuation professionals often rely on the weighted average cost of capital (WACC) or the internal rate of return (IRR) as a starting point.
The WACC is based on an analysis of market returns and represents the return on the investment required by market participants, including debt and equity investors. Specifically, the WACC represents the required returns on debt and equity capital weighted in proportion to their estimated percentages.4
An entity’s required return on equity capital is often estimated using the capital asset pricing model (CAPM).5 Other methods, such as the Fama-French three-factor model6 or the buildup method, may also be applied. Regardless, the WACC should include all relevant risk elements that an investor would consider when evaluating the intangible asset.
An IRR represents the discount rate that equates the net present value of a series of cash flows to a net present value of zero.7 The WACC and the IRR should be compared and reviewed for reasonableness when one performs a valuation analysis.
Although the WACC and the IRR are reasonable starting points for the discount rate, they should be tailored to the relevant intangible asset to ensure that any asset-specific risks are appropriately captured. Circumstances may arise when the appropriate discount rate differs from the WACC or the IRR, depending on the relative asset mix and the specifics of the intangible assets analyzed.
The current environment presents challenges for developing appropriate discount rates as well. Traditional methods, such as cost-of-capital measures, may be subject to certain obstacles. For instance, the equity volatility measures during the 2020 COVID pandemic were at levels last seen during the 2008 global financial crisis,8 and corporate credit spreads have also increased in that period.⁹ At the same time, economic growth projections have deteriorated, with certain economists predicting a recession for 2023 and beyond.10 Professionals performing intangible asset valuations may need to consider if adjustments are needed to account for current uncertainties and quantify them based on reliable data, appropriate methodologies, and sound professional judgment.
In addition to determining appropriate revenue streams, useful life, and discount rate for intangibles, certain other method-specific assumptions are important in establishing an appropriate FMV estimate for them. In the following sections, we describe certain method-specific considerations under two commonly applied methods, the relief-from-royalty method (RFRM) and the multi-period excess earnings method (MPEEM).
Relief-From-Royalty Method
The RFRM establishes the fair market value of intangible assets based on hypothetical royalty payments that would be saved by owning the intangibles instead of licensing them from a third-party licensor.11 The RFRM generally involves these primary steps:
- projecting financial information for the company owning the intangible asset, including appropriate revenue streams, growth rates, and tax rates;
- establishing the useful life of the intangible asset, which should be reflected in financial forecasts;
- estimating an appropriate royalty rate for the intangible, derived from an analysis of comparable transactions;
- applying the appropriate royalty rate to the projected revenue stream over the forecast period to establish an appropriate forecasted royalty stream;
- determining an appropriate discount rate; and
- discounting the projected royalty streams to present value with the discount rate.
Previously, we discussed establishing appropriate revenue streams, useful life, and discount rate in the context of the income approach. Our next section addresses determining an appropriate royalty rate for the analysis.
Royalty Rate
Typically, a royalty is a payment made by the licensee (the intangible user) to the licensor (the intangible owner) for the use of certain intangibles the licensor owns.
The most common payment is a royalty rate expressed as a percentage of revenues (for example, net or gross sales). Other forms include:
- a royalty payment expressed as a percentage of profits (for instance, net or gross margin);
- a royalty payment based on units of production or sales;
- a predetermined royalty amount paid periodically;
- a single up-front royalty payment; and
- a royalty payment based on development costs (for example, for early-stage technology).
Two fundamental factors influence royalty rates. The first is the total earnings generated by the intangible asset; the second is the licensor’s and licensee’s share of earnings. Royalty determination is often complicated by uncertainty about each party’s economic contribution to developing the intangible asset. Complications often arise when intangibles are bundled with complimentary assets. Dissecting earnings among various contributing assets may be complex.
An alternative is to base the royalty rate on comparable licenses of similar intangibles. However, distinctions among intangibles and the subtleties of license agreements may complicate matters.
An analysis of royalty rates for comparable intangibles should consider all relevant comparability factors, including:12
- the relevant rights and risks of the intangible ownership;
- the market demand for and the expected economic benefits from the intangible asset;
- the similarities between the intangible and comparable transactions, including the intangible’s development phase, nature and characteristics, and expected remaining useful and legal life;
- the market conditions near the valuation date, including the range and comparability of the intangible’s geographic market; and
- the terms and conditions of the license, such as contractual or legal restrictions (e.g., exclusivity), duration, and the specific rights and responsibilities of the licensor and licensee.
Due to these differences, determining an appropriate royalty rate may be difficult, especially under current uncertainties. Appropriate royalty rates from comparable license transactions may be unavailable, in which case valuation professionals may need to consider other methods, such as the MPEEM.
Multi-period Excess Earnings Method
The MPEEM is another commonly applied method under the income approach. It isolates cash flows associated with intangible assets and determines the FMV by discounting the cash flows to their present value with an appropriate discount rate.13
The primary steps for the MPEEM generally are:
- projecting financial information for the company that owns the intangible, including establishing appropriate revenue streams, growth rates, and tax rates;
- establishing the useful life of the intangible asset, which should be reflected in financial forecasts;
- subtracting cash flows attributable to other assets through contributory asset charges (CACs);
- calculating cash flows attributable to the intangible asset subject to the valuation;
- determining an appropriate discount rate for the cash flows; and
- discounting the cash flows to present value with the discount rate.
We previously discussed establishing appropriate revenue streams, useful life, and discount rate in the context of the income approach. Our next section addresses determining an appropriate CAC for the analysis.
Contributory Asset Charges
Most intangible assets must be integrated with contributory assets to generate income. Therefore, the FMV analysis of intangible assets often starts with identifying overall earnings derived from the intangibles and other contributory assets.
Afterward, CACs are identified by evaluating all relevant assets that contribute to earnings, such as working capital and fixed assets. CACs are essentially fair returns on an entity’s contributory assets, which are tangible and intangible assets used in the production of income or cash flow associated with the intangible asset being valued. CACs may be expressed as a percentage return on an economic rent associated with, or a profit split related to, the contributory assets.14
Excess earnings attributable to the intangibles being valued are then determined by deducting CACs from overall earnings.
Market Approach
The market approach determines the fair market value of intangible assets relative to current market prices of similar intangible assets sold under similar conditions.15
The market approach may generally be easier to navigate than the income approach; however, in certain cases reliable market data may be difficult to identify for the analysis. The market approach generally consists of the following primary steps:
- collecting appropriate financial data for the intangible;
- performing searches for comparable intangibles or transactions;
- calculating appropriate comparable valuation ratios or margins; and
- determining the intangible asset’s FMV by applying appropriate valuation ratios or margins to the relevant financial data for the intangible.
Cost or Asset Approach
The cost or asset approach estimates the value of the intangible asset based on the cost required to either reproduce or replace the asset. The method of determining the cost to reproduce or replace an intangible asset may vary greatly depending on the specifics.16 Two common methods under the cost or asset approach are the reproduction cost and the replacement cost methods.
Reproduction Cost Method
The reproduction cost method determines the value of the intangible based on the cost required to replicate or reproduce it. An important characteristic of this method is the reproduction of an identical replica of the intangible asset.17
Replacement Cost Method
The replacement cost method is similar to the reproduction cost method, but with certain differences. The replacement cost method determines the value of the intangible based on the cost required to furnish a similar new property having the nearest equivalent utility to the intangible asset being valued.18
Arm’s-Length Standard
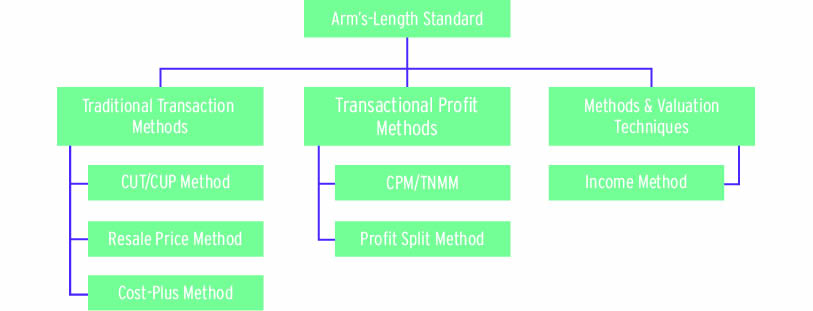
The ALS is a tax valuation standard applied to determine arm’s-length results in controlled transactions. The ALS aims to place controlled taxpayers on tax parity with uncontrolled taxpayers, by determining the true taxable income of controlled taxpayers according to the standard of uncontrolled taxpayers dealing at arm’s length. According to Treasury Regulations Section 1.482, a controlled transaction meets the ALS if the transaction results are consistent with those that would have been realized if uncontrolled taxpayers engaged in the same transaction under the same circumstances.19 In this section, we address certain commonly applied intangible valuation methods under the ALS. Figure 2 shows various arm’s-length methods.
We primarily focus here on the income method, which is commonly applied for the arm’s-length valuation of intangible assets. We also provide a high-level overview of certain other methods, such as the CUT/CUP method and the CPM/TNMM method, that may be used to derive certain inputs (for example, underlying royalty rates or returns) for the income method.
Income Method
For intangible valuations under the ALS, valuation professionals should consider the transfer pricing rules described in the Treasury Regulations under Section 482 of the Internal Revenue Code (IRC) and in the Organisation for Economic Co-operation and Development’s (OECD’s) Transfer Pricing Guidelines (hereinafter the OECD Guidelines).
According to Treasury Regulations Section 1.482, evaluation of whether a controlled transaction produces an arm’s-length result should be made according to the best method rule.20 The Regulations provide several specified methods for transfers of intangibles, such as the comparable uncontrolled transaction (CUT) method, the comparable profits method (CPM), and the profit split method (PSM).21 In addition, Section 1.482-4 of the Regulations allows for other methods to evaluate whether the amount charged in a controlled transaction is at arm’s length if the method is applied following the provisions of Section 1.482-1 of the Regulations.22 Such methods are referred to as “unspecified” methods. They may include the methods specified under Section 1.482-7 of the Regulations, such as the income method applied for determining arm’s-length results for controlled transactions involving cost-sharing arrangements.23
In addition, chapter 4 of the OECD Guidelines discusses several methods to establish arm’s-length pricing for intangibles, including traditional transactional methods such as the comparable uncontrolled price (CUP) method,24 the resale price method (RPM), and transactional profit methods such as the transactional net margin method25 and the transactional profit split method.26 The OECD Guidelines recognize that in situations where reliable comparable uncontrolled transactions for transfer of intangibles are unavailable, it may be possible to apply valuation techniques. In particular, the application of income-based valuation techniques such as techniques applying the discounted value of projected future income streams or cash flows derived from the exploitation of the intangibles may be appropriate. Depending on the specifics, valuation techniques may be used by taxpayers and tax administrators as a part of the OECD transfer pricing methods described in chapter 2 of the OECD Guidelines or as a tool to identify an appropriate arm’s-length price.27
How to Implement
The income method under the ALS generally includes these primary steps:
- projecting financial information for the subject company; as with the FMV analysis, this includes establishing revenue streams, growth rates, and tax rates;
- establishing the useful life of the intangible asset; as with FMV, the forecasted financial information should reflect the asset’s estimated useful life;
- estimating an appropriate royalty rate for the intangible, which may be derived through other transfer pricing methods, such as the CUP/CUT or profit split methods;
- applying the royalty rate to the forecasted revenue stream over the forecast period to establish forecasted royalties;
- determining an appropriate discount rate; and
- discounting the forecasted royalty streams to present value with the discount rate.
Methods to Derive Royalty Rates
Other transfer pricing methods may be required to determine an appropriate royalty rate during the application of the income method under the arm’s-length standard such as the CUP/CUT or the profit split methods.
CUT/CUP Method
To establish arm’s-length royalty rates under the income approach, one commonly applied method is the CUT/CUP method, which identifies royalty rates from comparable uncontrolled licensing transactions for similar intangible assets.
According to Treasury Regulations Section 1.482, the CUT method evaluates whether the amount charged for controlled transfers of intangibles was at arm’s length compared to the amount charged in comparable uncontrolled transactions. Suppose an uncontrolled transaction involves the transfer of the same intangible under the same circumstances as in the controlled transaction. In that case, the results derived from the CUT method will generally be the most direct and reliable measure of the arm’s-length result. Circumstances between controlled and uncontrolled transactions will be considered substantially the same if only minor differences exist.28
The OECD Guidelines include a similar method, the CUP method, which compares the price charged for property transferred in a controlled transaction to the price charged in a comparable uncontrolled transaction with comparable circumstances. Suppose the two prices differ. This may indicate that the conditions of the commercial and financial relations of the associated enterprises are not at arm’s length and that the price in the uncontrolled transaction may need to be substituted for the price in the controlled transaction.29
Profit Split Method
Another commonly applied method to establish arm’s-length royalty rates is the profit split method, which calculates profit data attributable to the intangibles based on the relative share of profits allocated in uncontrolled transactions.
According to Treasury Regulations Section 1.482, the profit split method evaluates whether the allocation of the combined operating profit or loss attributable to one or more controlled transactions is at arm’s length by reference to the relative value of each controlled taxpayer’s contribution. The combined operating profit or loss must be derived from the most narrowly identifiable business activity of the controlled taxpayers for which data is available. The relative value of each controlled taxpayer’s contribution must be determined to reflect the functions performed, risks assumed, and resources employed by each participant.30
The OECD Guidelines include a similar method, the transactional profit split, which establishes arm’s-length results for controlled transactions based on the results that would have been achieved between independent enterprises in comparable transactions. The method identifies the profits from controlled transactions and splits them based on an economically valid basis according to each associated enterprise’s contribution and the compensation which would have been agreed to in comparable transactions. The transactional profit split method is often applied when the compensation to the associated enterprises can be reliably valued by reference to the relative shares of their contributions to the relevant intangibles.31
Other Differences Between ALS and FMV
Besides the difference in legislative background and the valuation methods, a number of other differences between the FMV and ALS exist. The following summarizes some of the other differences.
Scope of Assets
The FMV standard typically values distinct intangibles on an asset-by-asset basis and captures future growth values within goodwill. Valuations performed under the ALS often cover a bundle of intangible assets (that is, intangible asset platform) including future growth. FMV typically involves distinct make-sell rights (for example, developed technology). In contrast, ALS valuations often aggregate make-sell rights and use rights (for instance, entire intangible asset portfolio).
Residual Returns
During the application of the MPEEM under FMV, residual returns attributable to the intangible asset are established through the deduction of CACs which typically include working capital and fixed asset charges. With the profit split method under the ALS, residual returns attributable to the intangible asset are established by deducting routine returns associated with various routine activities (for example, routine R&D, manufacturing, or distribution services) benchmarked through ALS methodologies.
Tax Basis
The FMV standard generally relies on after-tax cash flows as the starting point for analysis. On the other hand, the ALS often relies on pretax operating profits.
Conclusion
Given the differences between FMV and ALS, it is important to identify the appropriate tax valuation standard as the first step when valuing intangible assets. If multiple tax valuation standards need to be satisfied, appropriate steps should be taken to ensure that all relevant rules and requirements are considered to avoid potential controversy. In the current environment, this attention becomes critical, since financial projection uncertainties and data reliability issues may create further complexities and challenges.

Tom K. Gottfried is a managing director at Valuation Research Corporation.
Endnotes
- IRS Revenue Ruling 59-60.
- Internal Revenue Manual (hereinafter IRM) 4.48.5 (Intangible Property Valuation Guidelines).
- IRM 4.48.5.
- “What Is the Weighted Average Cost of Capital (WACC)? Definition, Formula, and Example,” CFAJournal, accessed January 12, 2023, www.cfajournal.org/wacc/.
- Eugene F. Fama and Kenneth R. French, “The Capital Asset Pricing Model: Theory and Evidence,” Journal of Economic Perspectives 18, no. 3 (Summer 2004): 25–46.
- Eugene F. Fama and Kenneth R. French, “Common Risk Factors in the Returns on Stocks and Bonds,” Journal of Financial Economics 33, no. 1 (1993): 3–56.
- Rosalie T. Ruegg and Harold E. Marshall, “Internal Rate-of-Return (IRR),” in Building Economics: Theory and Practice (Boston: Springer, 1990), 67–78.
- Federal Reserve Bank of St. Louis, CBOE Volatility Index, accessed January 3, 2023, https://fred.stlouisfed.org/series/VIXCLS.
- Federal Reserve Bank of St. Louis, ICE BofA US Corporate Index Option-Adjusted Spread, accessed January 3, 2023, https://fred.stlouisfed.org/series/BAMLC0A0CM.
- Justin Damien Guénette, M. Ayhan Kose, and Naotaka Sugawara, “Is a Global Recession Imminent? Equitable Growth, Finance, and Institutions Policy Note,” World Bank Group, EFI Policy Note, September 4, 2022.
- American Institute of Certified Public Accountants Inc., VS Section 100: Statement on Standards for Valuation Services, Valuation of a Business, Business Ownership Interest, Security, or Intangible Asset, June 2007, www.aicpa.org/resources/download/statement-on-standards-for-valuation-services-vs-section-100 (hereinafter VS Section 100).
- IRM 4.48.5.
- VS Section 100.
- VS Section 100.
- IRM 4.48.5.
- IRM 4.48.5.
- VS Section 100.
- VS Section 100.
- Treasury Regulations Section 1.482-1(b).
- Treasury Regulations Section 1.482-1(b).
- Treasury Regulations Section 1.482-4(a).
- Treasury Regulations Section 1.482-4(d).
- Treasury Regulations Section 1.482-7(g).
- Organisation for Economic Co-operation and Development, OECD Transfer Pricing Guidelines for Multinational Enterprises and Tax Administrations, 2022, paragraphs 6.146 and 6.147, https://read.oecd-ilibrary.org/taxation/oecd-transfer-pricing-guidelines-for-multinational-enterprises-and-tax-administrations-2022_0e655865-en#page1 (hereinafter OECD Guidelines).
- OECD Guidelines, paragraph 6.141.
- OECD Guidelines, paragraphs 6.148 through 6.152.
- OECD Guidelines, paragraph 6.153.
- Treasury Regulations Section 1.482-4(c).
- OECD Guidelines, paragraph 2.14.
- Treasury Regulations Section 1.482-6(b).
- OECD Guidelines, paragraph 2.114.